The T Report: Corporate Bond Chaos, ETF’s, and JPM’s “additional losses”

Corporate bonds in the U.S. took a beating in the past 48 hours. The high yield market, which had been spared much of the carnage seen in the HY CDS markets, finally succumbed.
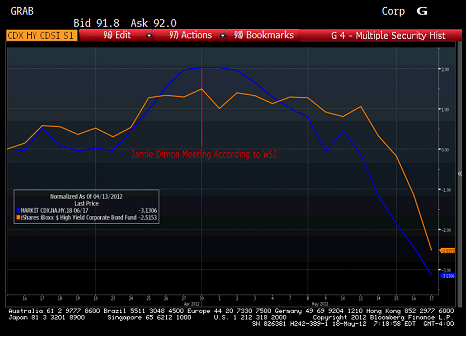
This chart is key for a couple of reasons. First it shows that the 3 point drop this week and the 2 point drop in the past two days for HYG is largely a catch up to moves that had already occurred in the CDS market. We still think of HYG as a “retail” product, but volumes have spiked in recent days as it has become a valued source of liquidity. Hedge Funds have been looking at the ETF versus the HY CDS index. A trade we have liked, that as recent as 4 months ago was generally met by polite grins from some of the HF’s we talk to. Now it is a strategy people like. More investors and market makers are looking at the ETF’s as a better way to hedge themselves than using the CDS index. The HY ETF’s have their own sets of problems, but there is a growing realization, particularly in the high yield market, that at least they move with their bonds more than the CDS indices.
We are starting to see spikes to the downside late in the day. It could be for any number of reasons, but the reality is that I think it is market makers more than anyone who are causing that. To the extent you get hit on bonds in the morning (you didn’t fade your bid fast enough, or the client was too important) you spent the whole day trying to move those bonds. With everything going on in Europe you don’t want (or aren’t allowed) to be long overnight. Your choices are hitting a down bid on the bonds – probably a loss of at least 1%, shorting HY18, which is already very cheap and the index guys get annoyed at anything less than $25 million, or, shorting some HYG. It might cost you a ¼ point, but that is better than selling the bond and it seems closer to the market than the CDS index which feels ripe for a squeeze. That flow is occurring.
The HY ETF’s are both trading at a discount. That is encouraging the arb which means arb clients will be selling bonds, buying shares, and then using share redemptions to monetize the trade. Again, it seems like a “market neutral” strategy, but for some reason, the selling of bonds seems to weigh more on the market than the purchase of the ETF’s. That adds to the downside pressure, and there is currently a big game going on of “which bond will the ETF’s sell”. That is adding to the volatility in the cash market.
I’m struggling to figure out what is affecting U.S. high yield so much. Hedge funds don’t seem too leveraged. Banks don’t have much inventory. Retail doesn’t seem spooked (the redemptions seem to have as much to do with arb activity as retail outflows). I think this is the opportunity we have been waiting for to increase our allocation in HY in our Fixed Income Allocation.
I have to say something about JPM here. The positions at some level were long assets in an available for sale account (which had over $7 billion of untapped profits on a portfolio of $200 billion, according to the transcript). From everything else I have pieced together they were short HY market via CDS and long IG via CDA – JPM details. You notice how HY CDS got tighter every day from the 21st until the 30th. That would likely have produced a loss in the whale trade. According to the WSJ, there was a meeting on the 30th. Between then and the 10th when the call occurred, HY moved in their direction every day. That move has accelerated. How much of this hedge did they keep? Did the funky nature of their hedge perform the same as the on the run index? There is no way to know what happened, but on the HY CDS leg, the market has done nothing but move in their direction since that first emergency meeting. Their cash positions in the AFS, which should be marked at the lower of cost and market value, had an average gain of 3.5%. That portfolio, using that form of accounting won’t have had a loss (it probably has less untapped gains, but no accounting loss). Again, impossible to know what happened there, but certainly food for thought.
Investment grade also was in real trouble yesterday, though the CDS market has been indicating that for days. LQD was down almost a point, and that is on a day where TLH was up over a point, amplifying the spread widening. While cash was that weak, IG18 only weakened into the close at it, somewhat surprisingly spent most of the day near unchanged. While the selling pressure in the cash market was real, and somewhat scary, the relative strength in CDS was encouraging as it has been the leading indicator in this entire sell-off that really started after the JPM announcement.
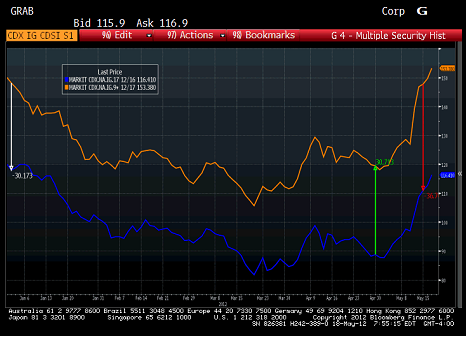
This graph shows the IG9 10 year index and the IG17 5yr since the start of the year. You can clearly see how fast the widening has been, which started in early May and accelerated after the JPM conference call. There are a couple of things worth thinking about here. For everyone just looking at the performance of IG9 10 year and “guessing” what the additional JPM loss is, it makes almost no sense. If it was that simple, JPM would have had huge gains on this trade in the first quarter. Even in April the change wasn’t much. If it was all the “basis” and the difference between the indices that caused the problem, you have the same issue, that it was fairly stable though out the year. It has widened, which is likely bad, but again, doesn’t really explain the P&L. If IG9 was actually tightening coming into April 30th, why was JPM having losses? First, IG9 did seem to move slightly less than IG17 in those last few days of April. But if JPM was long the index, they should have some gains. The problem, I believe, and am trying to confirm, is the tranches didn’t move with the overall index. A quick look at MBIA, which would be a driver to the tranche price (the ones JPM had on, have a higher “delta” on the weakest names) supports that. MBIA CDS actually widened from April 17th when it was 884, to 970 by April 30th. Radian had an even larger move wider, which again would have hit pricing on “mezz” and “equity” IG tranches. Doing more work, but it will have been a widening in high beta names, driving the tranches they owned wider that would explain the loss. The underperformance of IG9 vs IG18 in that period is largely because of the high beta names, the ones JPM had the most exposure too. The big question here, is did they just go very short IG17 or IG18 against the tranches in that first part of May when it was freely for sale, still trading rich, and priced as low as 93 for IG18 which is currently at 120? Again, impossible to know, but the simplistic IG9 10 year explanation that is out there has no real basis in fact.
Maybe the G8 will threaten Germany with becoming the Growth 7 and she will cozy up and change her tough stance? It is scary that the ECB and Germany seem oblivious to the risk of a Grexit, and I’m frankly scared at some of the simple solutions the ECB seems to have for their losses – put them into the EFSF. But more people are coming out and pointing out the dangers, and Europe if anything, has demonstrated great fear of decision and kicking the can with a skill that even Messi envies.
E-mail: tchir@tfmarketadvisors.com
Twitter: @TFMkts