The Weekly T Report: Dream the Impossible Dream?
Too Early To Dream of a Fix, but Worth Reviewing what has happened
If “buy and hold” and the “carry trade” is the dumb money, it has done pretty well, even in Spain of all places. There have been opportunities to short Spain and make a lot of money, but it is worth pointing out how resilient it has been.
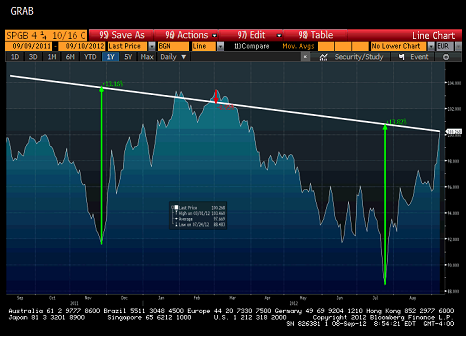
The best total returns for buying the Spanish 5 year were just over 13%, back in November of last year and this July. Had you bought at the peak of LTRO fever you are still down about 1%. I don’t do buy and hold, and was extremely bearish leading into LTRO, but it is a stark reminder that being short pits you against uneconomic buyers with deep pockets. I am now neutral at these levels, and will go into detail when I examine the risks of “Outright Monetary Transactions” or OMT.
The outperformance or “re-coupling” has been extraordinary. Since the July 24th, the day after I was on Bloomberg TV recommending Spain because the alternative was too bad for the ECB to ignore, and the day before I asked How Dumb is Draghi?
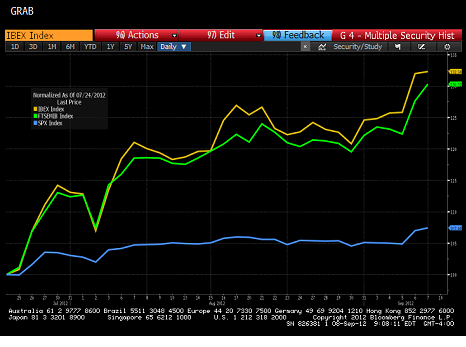
It turns out not so dumb. Since the “whatever it takes” day, the markets in Europe have surged. The 7% return on the S&P since then isn’t shabby, and we liked U.S. markets for much of that time, but the more than 30% returns in Spain and Italy are stellar, and even more phenomenal if you look at them in USD, since the FX rate moved from 1.206 on July 24th to 1.282 yesterday.
Re-coupling has been one of our main themes.
Another theme has been that banks and CDS would do well. Not just European banks and CDS but U.S. ones.
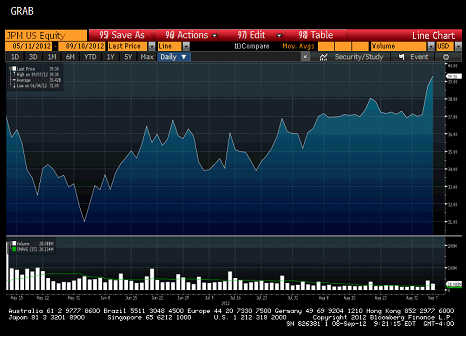
On the banking side JPM has been our main focus as we felt the whale trade was exaggerated, the LIBOR issues appeared smaller there than some other U.S. banks and we have believed that the housing market is stabilizing. We got out of the stock when it got back to above $37.50 the first time because it really was a play on getting back to May 11th levels, the day after the infamous “whale conference call”. We missed the last big move up but are not prepared to chase it, in spite of still being well below peaks from earlier this year.
We see low trading volumes being a problem for the money center banks, and although we think JPM has less to worry about on the LIBOR side than some other banks, the headline risk is there. If the Fed does go ahead with some QE this week, the banks will do well based on their existing mortgage inventory and on hopes that housing continues to improve. We don’t think that will happen, so are not long this here.
That brings us to the last chart that deserves a look. U.S. CDS has done particularly well recently. There is a big squeeze and it is more evidence of “re-coupling” where underperforming assets have caught up. To some extent, anything that was viewed as a good way to short the market has come screaming back with a vengeance.
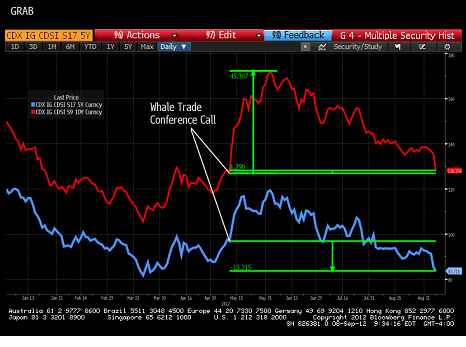
There are two ways to look at this chart, the first and more traditional is from the start of the year. I couldn’t resist using IG9 10 year since it was all the rage. I also used IG17 as opposed to IG18 since the on the run index wasn’t created until end of March.
IG17 is now 36 bps tighter on the year. It started at 120 and is down 84. That gets close to a total return of 2% including carry. Not bad. IG9 is also tighter on the year, but tells a more interesting story.
It was trading too rich, and to a large degree, that richness getting normalized is why it has underperformed. Do the regulators have any blame here? IG9 10 year moved 45 bps wider in the aftermath of the whale trade announcement. Everyone became an expert on the whale trade. Suddenly everyone knew it was bad. JPM had its balance sheet managed by the government, regulators, and pundits. Ironically, IG9 10 year is now only 1 bp wider than the night of that conference call.
JP was never in danger of default from the trade. No amount of taxpayer money was going to have to bail them out. We don’t know about all the moving pieces, or what they would have done otherwise, but maybe next time, before all the smug faces say how bad Jamie Dimon managed the business, they will remember they forced them out at the wides.
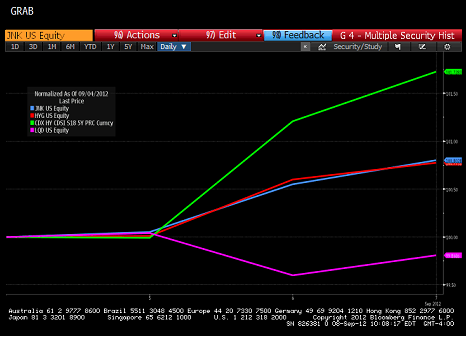
One final chart worth looking at that highlights another one of our ideas. We have been arguing for a period of time that the HY bond market is tricky here and cannot be just bought on a “beta” basis. Too many of the bonds have treasury risk so will not perform well in a “risk on” environment that causes treasuries to sell off. Too many bonds are trading at yield to call levels so just don’t have upside. Specific bond selection with a focus on credit, duration, and appropriate rate hedges is necessary to perform well. HY CDS, with the added benefit of having a short base, outperformed a lot this week (it has for awhile even when adjusted for the dividends paid).
The two HY ETF’s had almost identical performance during the week of 0.8% better. HY CDS was up 1.7%. At the other end is a real potential issue, that LQD was lower on the week. The spread tightening didn’t keep up with the move in treasuries, so on a yield basis, LQD was down. I have long been concerned that too many people say “spreads are cheap” but then buy yield products. Given the run that credit investments have had, this is just a blip, but investors should be wary about owning corporate bonds without a treasury hedge, and that goes for BB’s as well.
The next move higher for HY will have to be new issues and smaller, weaker credits, as they join in the rally. Broad based “beta” plays will likely continue to underperform. I believe CDS will continue to outperform.
Outright Monetary Transactions
There are weeks when it is hard to point to a single event that drove markets. We don’t have that problem here. Without a doubt, the OMT gave markets a big boost. This was the culmination of weeks of hints, ideas, leaks, debate. So what does it do?
In the best case, it does a lot.
The first step is for a country to sign up for the program. They would work with the IMF to determine conditions the country needs to meet. What progress needs to be achieved to remain in the program. At this stage no country has asked to be included, so we don’t know the terms. I suspect the terms will be reasonable. It may go a little beyond the “fiscal compact” the countries have already signed, but I don’t think it will be much more onerous than that.
So the first step will be asking for aid and agreeing to the conditions. This could still be a potential impediment.
Then the ECB would be able to buy bonds in the secondary market, while the EFSF (or ESM) would be able to buy bonds in the primary market. This should allow the ECB to keep rates low and reward institutions that buy the debt of the countries in the program. The EFSF could buy up to half the new issue. I can easily see the combined effects of direct primary intervention by the EFSF and the secondary market support by the ECB, keeping demand for debt high.
The effort will be focused on bonds with maturities out to 3 years. The effort at the front end makes sense, as it was far easier to get people behind the idea. Politicians and non credit investors tend to constantly underestimate the front end risk, but Draghi used this to his advantage. There is a practical benefit to focusing on the front end as well. Italy for example has €1.6 trillion of debt, but “only” €700 billion maturing by end of 2015. Focusing on just the BTPS (and not the t-bills which seem to have their own safe haven status) the numbers break down to €1.2 trillion and less than €400 billion.
Even adding in the additional borrowing countries running a deficit will need, the numbers become “reasonable” in the context of the ECB and EFSF. Defending the entire curve would just be too costly, fighting the front end is easier.
Rolling 3 year versus program termination. In the “best case” the program remains in place and the ECB and EFSF are able to roll debt and continue to support out to 3 years. This could go on for a long time. You will likely see weird shape curves where the steepening is centered around the ECB intervention dates, but over time, more bonds would get sucked into that vortex of ECB/EFSF/ESM support. That is the “best case”. In the “worst case” the country fails to meet program criteria and the ECB/EFSF/ESM pull the plug. The purchases are unlimited until they aren’t. If the “conditionality” has real teeth, then this could happen. We could see countries being forced to leave.
From what we have seen with Greece, I think it will take far longer to pull the plug on a country than anyone would expect. In fact, I can’t help but think that Draghi is purposely heading down the slippery slope to ensure that the ECB and EU integrate more rather than less. That he knows politicians won’t like losses, and will always up the program.
So, while the program has risks and flaws, I expect it to help in the intermediate term. Bond markets especially.
What it will do for stock markets is more of a question. At some point economies need to be turned around. Banking systems fixed. Profits to rise. I am less convinced that the EU can pull that off, but if they can stop focusing on bailouts and focus on fixing policies, a combination of austerity and growth, Europe may finally have turned the corner.