The T Report: Bad Bear Tells – VIX, Volume, High Yield, Spanish 10yr
Nervous Short
I remain short. I am flat Spain, Italy, and banks. I am short U.S. stocks here. I like CDS, but think IG18 will drift back to over 100 before it can take another leg tighter.
I think so much has been priced in from the ECB, that we face some disappointment as more plans get leaked or opposition becomes more vocal. I believe the ECB will do something that is sufficient to change the dynamics in Europe for a period of time, but think they are constrained enough, that the market may underestimate their plan. The market will view it as insufficient. LTRO1 remains a prime example. Everyone bought the rumor, sold the news, and then decided they better actually buy the news.
What concerns me most about being short, is that it seems very crowded. Not only is it crowded, but many bears (or underweight bulls) are pointing to the same things as reasons to be short, and some of those reasons don’t seem right to me. Here are 4 things too many people seem to be focused on and drawing potentially the wrong conclusions from, and why I don’t think any pullback at this stage will be meaningful and why I will be looking to cover and get long again on a relatively minor move.
VIX
It is impossible to read or listen to financial commentary without someone mentioning VIX and what a sign of complacency it is. Try it if you don’t believe me. Spend 1 hour paying close attention to the media and see how often VIX is cited and how it is universally accepted that this is a sign the market is due for a correction.
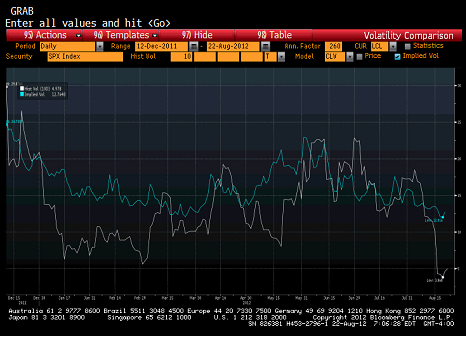
The following chart looks at the implied volatility of 30 day at the money S&P 500 options versus the last 10 days of realized vol. Implied volatility is much higher than realized volatility here. People are willing to pay up a little in expectations that volatility will increase. How much more than realized vol would you expect someone to pay? At some level, there are options traders who make a living trading the gamma. How much do you expect them to pay for that? They just won’t bid up option prices when realized volatility is low.
So yes, there are a variety of indicators from options that hint at complacency, but it isn’t horribly obvious to me that VIX is complacent relative to movement, and I am yet to see a study showing VIX is a leading indicator of anything.
I could see traders getting caught short gamma in a big move, causing the price move to become amplified, but I am becoming just as concerned about that in an up more as in a down move.
Volumes
Another thing many bears are pointing to is the lack of volume. The rally is not being “confirmed” by volume. I think volume is useful, but we have gone through other extended periods where volume didn’t confirm a trend, yet the trend continued.
Volume, to be important, in my opinion, must represent actual flows of people buying and selling shares to change their risk position. For better or worse, that represents only a fraction of the volumes in high frequency, sub-penny, rebated, etf arbitrage, etf creation, etf redemption, dark-pool, cross exchange arbitrage, sub-penny, and algorithmic trading driven world.
We can pretend that daily volumes are driven by customer buy and sell orders, but that just isn’t the case. So much volume is driven around the ETF products and replication that any change there filters through the system.
We can also ignore the fact that most volume indicators are based on number of shares rather than market value, but I’m not sure why we can ignore that. If stocks traded X shares when the S&P was at 1275, why would we expect X shares to trade when it is at 1425? From a “value” traded, the drop-off isn’t as bad. Most investors think in terms of money at risk, not number of shares at risk, so why is all the focus on volume in terms of number of shares?
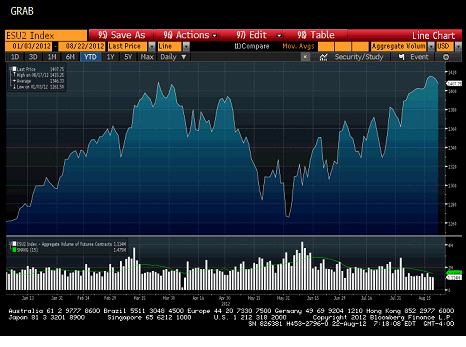
And finally, what about Knight? Here is a nice chart of the S&P e-minis. While not a stock, I find it useful as one of the cleanest ways to trade the market. Look at the drop-off post Knight. Maybe they and other dealers decided to dial back some elements of their programs? Maybe it is a total co-incidence, but somehow, I doubt it.
High Yield Bonds
Another area of “weakness” or at least lack of “confirmation” has been the performance of the junk bond market. For many, this now means the ETF market. It is unrealistic to assume that high yield can perform in line with equities. High yield is almost a hybrid where it can exhibit bond like performance or equity like performance and we are in the stage where high yield looks more like a bond and less like an equity proxy.
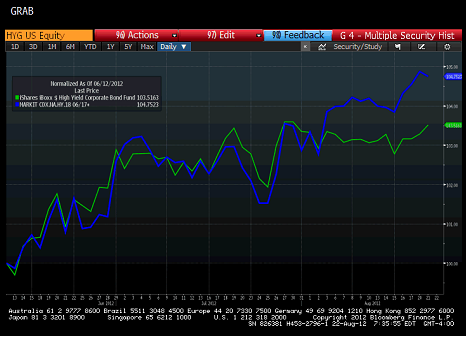
The market has done so well that many of the bonds now have a lot of rate risk and just cannot rise with stocks, because the move in yields is a drag. Another category of bonds are the high dollar price yield to call bonds. They just have limited upside from here, so also cannot move in line. Rather than looking at the ETF’s which are price based products, it is probably more useful to look at the CDS market. Love or hate CDS, at least it is a spread product with a fixed duration. Look at HY18 vs HYG since June 12th (after the ResCap settlement). While HYG hasn’t confirmed the rally, HY18 has, at least to some extent. The blue line is HY18 and it does show continued spread tightening.
2 of the largest holdings of HYG are the HCA 6.5% of 2020 bonds and the CIT 5.5% 2019 bonds. These trade sub 5%. The bonds have declined in price, while the spreads have narrowed. These bonds now trade far more like investment grade than traditional high yield. The rate risk is as important as the spread risk for their price. So these bonds sold off in price terms (while improving in spread terms) making it look like the high yield market wasn’t participating in the rally. More and more, you need to strip out some element of rate risk when analyzing how high yield did on a day, and it isn’t easy because too many of the other bonds have horrible convexity, and figuring out a “spread” is difficult too.
Still picking from HYG’s top 5 holdings, the INTEL 11.25% bonds of 2017 are an example. At a price of 105 they are trading to their 2015 par call, but it doesn’t take much of a move higher to push them to their 102.813 2014 call. At 105, the yield to maturity is 9.83% but the yield to call is 8.94%. That convexity definitely caps the potential for these bonds to appreciate.
So, a combination of bad convexity and rate risk means that just looking at the price of the HY ETF’s doesn’t give a true sense of how that market is doing. It isn’t as rate sensitive as LQD or MUB, but it cannot be ignored. The HY CDS market is confirming the rally if things like that are important, though to me it is just another risk on trade, one that I’ve particularly liked.
Spanish and Italian 10 Year Yields
In golf they say, drive for show, putt for dough. Well, in times of a credit crunch, which we are in, the 10 year is the drive. It is fun and exciting but the reality is the battle will be fought at the short end of the curve. The 2 year is boring, especially when not inverting, but that is more important to watch than the 10 year. The ECB may implement plans that help the front end more than the back end. They may even implement plans that hurt the back end, so watching that as a measure of the ECB’s “success” could lead to wrong conclusions. I wouldn’t ignore it, but anyone who tells you “the most important chart is the 10 year” is simply wrong. The 2 year will be the best indicator of what the ECB has accomplished, especially, if as I suspect, they limit their risk by focusing on that part of the curve.
E-mail: tchir@tfmarketadvisors.com
Twitter: @TFMkts