The T Report: If a Stock Doesn’t Trade, Does it Make a Sound?
If a Stock Doesn’t Trade, Does it Make a Sound?
There is a lot of talk about low volumes and what that means. There’s also a lot of chatter about low vix and what that means. I don’t pay much attention to each. I watch them, largely because others do, but don’t rely on them too much.
VIX is NOT a “Fear Gauge” and has NO Predictive Value
I have looked and find no useful predictive value from VIX. It may have had some value at one point in time, when only a few weird little quants in the corner took the time to figure it out and traded on it. But that was a long time ago, and its value as a leading indicator has dropped along with the ability to smack it down by hitting VIX futures, or lifting it higher by buying TVIX and other VIX related ETF’s.
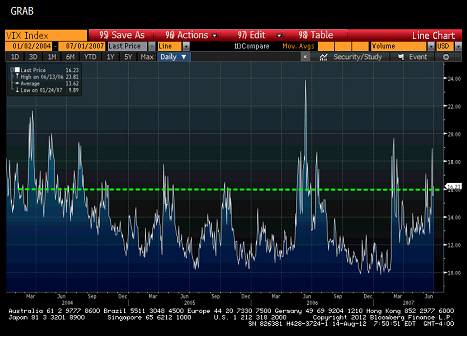
That is probably not the most common VIX chart you will see today. It doesn’t tell the whole story, but it does tell a useful story. From January 2004, until July 2007, VIX spent most of its time below 15, getting as low as 10, and only had brief spikes higher, and 24 was considered a big number.
I’m not sure that we are ready for that yet, but I am sure that we spend too much time looking at recent memory. There is a strong tendency to want to “revert to the mean” but too many people often use near term means rather than longer term means.
I pay more attention to recent changes in VIX than to absolute levels. We saw spikes ahead of big weekends and NFP that led me to believe the market was well protected. Right now, it looks like the market is getting complacent as VIX continues to slide while stocks remain in a very narrow range. This is tricky since VIX should be what investors are willing to pay for volatility and reduced “realized” volatility should cause VIX to go lower, but it is a warning sign that this rally is getting more susceptible to a decent pullback.
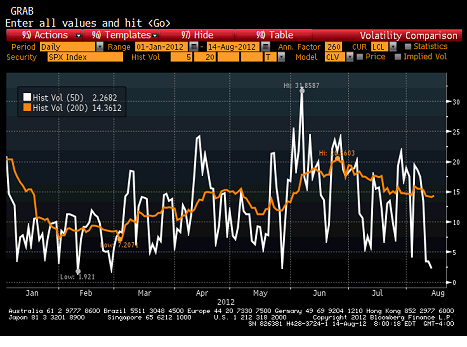
So here is the “realized” vol of the S&P 500 for the year. The 20 day is just below VIX. The 5 days is extremely low. This does support that VIX is moving down with Vol as much as anything and maybe is a reason that low VIX doesn’t imply impending doom. The impact of volumes has to be considered.
Volumes and What Generates Volume?
Somewhere deep down, many of us want to believe that one investor enters a buy order, and some other investor responds to that buy order and sells it to them, “like the good old days”. For better or worse, that is not how the market works.
Some “HFT” programs or “algos” require volatility to make their strategy work. This inextricably ties volumes to volatility. The best example is “ETF” or “Index” arb. Computers plugged directly into the exchanges (they pay the exchanges special fees to be located physically closer) look for minute discrepancies where they can piece together the stocks in an ETF versus the ETF itself. At times of high volatility, this can occur frequently. This spike in volumes isn’t a result of more investors needing to trade, but of computers that spot and capture the inefficiencies quickly. I have no problem with this particular type of HFT but it does influence volumes. Whenever we see decreased volatility, volumes drop, at least in part because of this. It seems, from my seat, that financials and the XLF are a favorite of these programs because the volatility has been high and the ETF relatively small.
Order “Disguise”. Away from things that I find odious, such as sub-penny churning, exchange paid rebates, flash orders across multiple exchanges, etc., some of the HFT’s are designed to help clients get better execution. The programmers, and users, feel that they can get better execution on large blocks using these programs. Some of these involve both buying and selling to accumulate a large block. Rather than just buying a million shares, the algo will accumulate that over time, but will sell shares as well as buying in an effort to hold down prices. Some trades will be purposefully deceptive so that other algos that “sniff” for large blocks to front-run, can’t discern those orders. That makes sense and is a strategy many humans will follow. It does mean that every order, say for a million shares, may generate 1.2 million buys and 0.2 million sells. So each order has a multiplier effect, before adding all the sub-penny and flash order “subterfuge” that goes on. As real clients have less to do, the volumes drop further.
Knight Capital Group. If you think that the drop-off in volumes has nothing to do with KCG pulling back their operations, or other similar computers being checked out for problems, than you are probably naïve. Maybe the NYSE’s idea to put in its own dark pool program, that was introduced the day the KCG computer went haywire, also has had an impact. A little “law” in the “frontier” goes a long way.
Volume, Volatility, and Positioning
Nothing about the vol and vol argument changes my current status. I continue to be long about 20% to 50%. I continue to favor Europe and Banks. I continue to believe that the broad U.S. market is more susceptible to a pullback than the European ones, especially as the campaign heats up. I think CDS can do better than bonds in terms of performance here. I don’t like “safe haven” bonds, particularly in Europe, but even here. High Yield bonds remain in the territory where the only significant performance to be gained is by moving to “story” credits. That should be coupled with a move down the liquidity curve. The liquidity premium is too high still, and the best value remains in off the run bonds, names, and CDS.