JPM: On 3rd and long, time running out, Jamie really took a knee?

We have talking about what may or may not have happened at JPM for the past week, and by “we” I mean the entire market. We do not know the exact nature of their trades, but as far as we can tell from what we read and the rumor mill, JPM had a series of complex trades, though the overall ideas seemed to be “short high yield” and cover the costs by being “long investment grade” with a particular emphasis of jump to default risk over pure spread risk (though spread risk played a big part).
They were short various XOVER and HY indices, both outright and in tranche form. They were long various IG indices, both outright and in tranche form, though with a few additional curve trades to manage the jump to default risk.
We have tried to estimate the scale of the positions by asking “how much would JPM want to make if HY sold off 10%”. Using that, and a guess of $5 billion, it gives you a reasonable guess that the HY short had to be the “delta equivalent” of $50 billion. The term “delta equivalent” is important, because a $1 billion move in the index, can have a “multiplier” effect on the price move in the tranche. In general, the first loss tranches will move much more than the index, so a $1 billion position in a tranche can behave like a $10 billion index position. A bit confusing but if you think of it if terms of how a “deep in the money” an “at the money” and a “way out of the money” option react to the price moves of the underlying stock, it is somewhat similar.
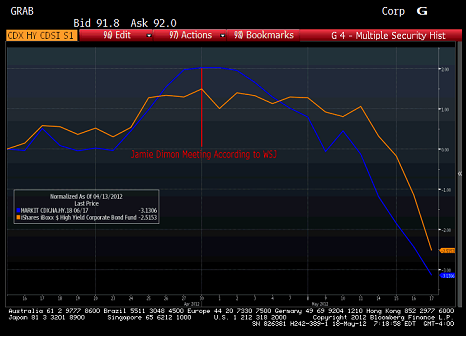
On Friday we looked at the HY CDS index and showed how it was actually tightening during the late April Period. It moved 2% in that time. If JPM was short $50 billion equivalent of HY at the time, they would have lost $1 billion on that position. Again, too simplistic to be accurate, but a reasonable working theory given everything we have seen. From the April 27th to April 30th period, when is seems like losses on the whale trade escalated to senior management, the index was stable and has sold off since then. Did JPM keep the hedge or not? I think they probably kept a decent amount of the HY hedge on as it was the original trade and was directly against positions at the bank and in the CIO’s AFS book that were appreciating at the time as well. They probably cut some of this, they probably sold some AFS bonds while cutting this. I suspect a chunk of the HY short remained on has made back some money. Just a guess, but I think there is logic to it, and it seems to fit the timeline that we know of so far.
But that is only one part. Another key part is the IG9 component, where they sold tranches. I have dug up some data as best as I could, and want to refine it, but think it is decent enough for these purposes (where we don’t really know the positions).
Let’s look at the IG9 3-7% tranche with a December 20th 2017 maturity.
|
|
Mid |
Index |
Delta |
|
1-Mar |
15.25 |
113 |
6.9 |
|
15-Mar |
15.88 |
114 |
6.6 |
|
31-Mar |
17.50 |
113 |
7.0 |
|
13-Apr |
20.50 |
123 |
7.5 |
|
23-Apr |
21.25 |
126 |
6.6 |
|
30-Apr |
18.50 |
119 |
7.0 |
|
1-May |
18.75 |
119 |
7.0 |
|
9-May |
23.25 |
130 |
6.5 |
|
11-May |
24.50 |
135 |
6.7 |
|
18-May |
30.00 |
155 |
5.9 |
JPM would have sold protection, so they would lose money as the cost of buying protection on the tranche went up. I chose the 3-7 as a pure guess, but it pays 500 bps per annum, like they HY shorts they had, and by being higher up in the capital structure, it would have done very well on stress tests mandated by the Fed which were very punitive on high yield, but relatively benign in terms of investment grade defaults.
Looking at “mid” which is the price it moved 2.25 points over the course of the month (I am not sure I have done some “delta adjustments correctly” and these aren’t “no delta” prices, so take with a grain of salt, but I think it is in the ballpark. This was the “small” loss seen in 1st quarter.
The move accelerated and moved 4 points by April 23rd. So they were losing money on the long side, AND losing money on the HY short they had. Let’s say they had a $15 billion position in this. Using a “delta” of 7, that would be a “delta equivalent” of $105 billion. That is in line with many of the stories that are out there about it being a $100 billion position. It makes some sense as it would be double the size of the high yield short. In a typical “compression” or “decompression” trade the ratio is anywhere between 4:1 and 6:1, so this would have left JPM with a net short position, which again, fits with what we hear they were trying to do. A 4% loss on $15 billion would $600 million. Maybe a bit low, so my “no delta pricing might be off” or the tranche bigger, or other things were going on as well, but at least my theory gets us to about $1.6 billion by late April.
By May 1st, the market was improving. You can see that the IG9 index tightened from 126 to 119. This then is the billion dollar question. What did they do after those meetings in late April? They couldn’t cover in IG9 tranches, the best they could do would be do go “delta neutral” and buy lots of IG9 protection. Even that would have been hard, so they would have had to buy IG18 proteciton.
If they didn’t buy protection, then there position has moved 7 points since May 10th. That would be another billion or so, though if they didn’t cover the IG, they probably didn’t cover much of the HY, so it could still be neutral or in their favor.
If they did buy the “delta” amount of IG18, a risky trade, but the best they could do, they could have covered $100 billion reasonably easy in the period from April 26th to May 4th, at a spread of 96 or better. That index is now at 123. On $100 billion, the P&L from a swing of 96 to 123 would be $1.3 billion, offsetting a lot of the bloodletting in the IG9 tranche.
It all comes down to what JPM did, in what size and at what price, but if they held the bulk of the HY short and only reduced that as they monetized bonds in the AFS book, and they neutralized the long in IG9 with some reasonable amount of on the run IG, the May 10th losses may NOT have gotten worse. At this stage the market seems convinced they have, and has over reacted to that number.
The market seems convinced other dealers had this trade on. NO WAY! This is horribly complex, and other dealers will have bits and pieces of this on, but since it is a pure CDS trade, there are short positions for every JPM long position and vice versa. Some of the winners will be sitting at hedge funds, but some banks will have made out okay on these trades as well.
Sorry if this is a complex tale, but it is a complex story. JPM may have done the worst, but if they did the best since they focused, the final result may be a pleasant surprise for them and the market.
E-mail: tchir@tfmarketadvisors.com
Twitter: @TFMkts