Is 6% The Point Of No Return?
With Italian 10 year bonds crossing the 6% yield threshold, it is worth seeing how other bonds behaved.
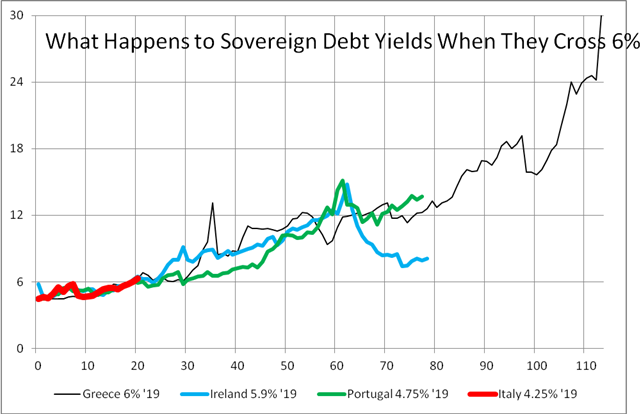
For Greece, the chart starts on September 4th, 2009, and it first crossed the 6% threshold in the week of January 15th, 2010.
For Ireland, the graph starts on May 7th, 2010 (right before the original bailout) and it breaks 6% for the first time during the week of September 10th, 2010 (around the time of EFSF V1.0’s announcement).
For Portugal, the graph starts on May 14th, 2010 (right before the original bailout) and it breaks 6% for the first time during the week of September 17th, 2010 (around the time of EFSF V1.0’s announcement).
For Italy the graph starts on June 17th 2011 (before the “big” July bailout) and it just crossed the 6% threshold.
Greece broke 6% and never looked back. It had a few rallies, but never really got close to 6% again.
Portugal and Ireland had similar experience until quite recently. Portugal continues to track the path first blazed by Greece. Maybe Greece is unique, but from a time series study, Portugal seems right on track to follow it. Ireland has materially turned the corner, though it hasn’t improved recently. I don’t think it is a co-incidence, that Ireland had let some financial institutions experience Credit Events, and then it turned the corner.
It is too early to tell what path Italy will follow, but at least for the other countries, they traded similarly prior to the breach, and followed similar paths after the breach. Italy is too big, that I don’t think it can turn like Ireland did. If Italy moves much further, I think it will follow Portugal and Greece. They don’t have months to fix this, they have weeks, and they have been squandering them.

